Economic Commentary – Review of Q3/2023
The economy
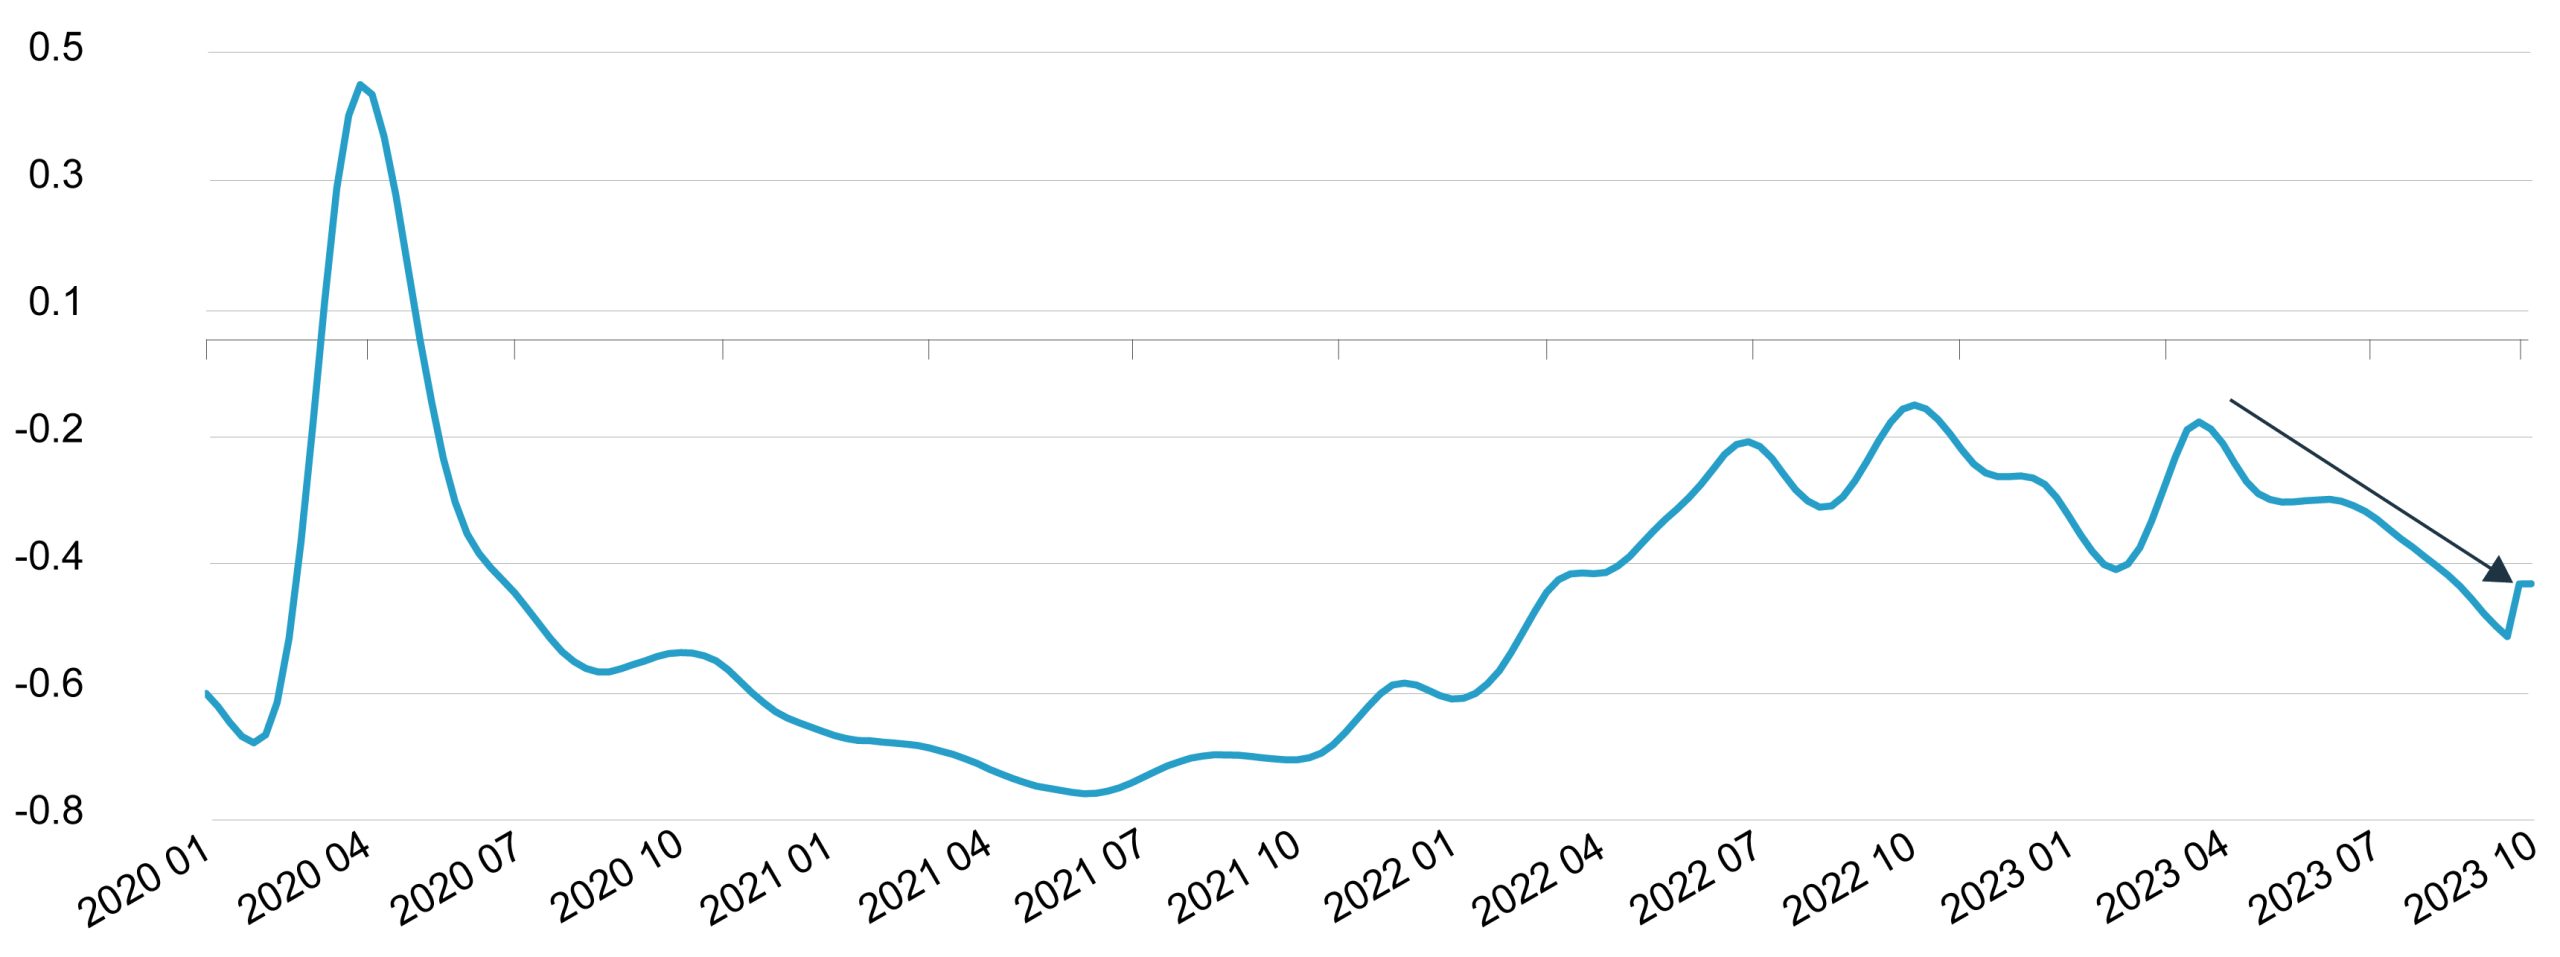
Monetary conditions tightened in September 2023 and financial markets responded by contracting. The Chicago Federal Reserve’s National Financial Conditions Index reveals the extent of the tightening.
Chart: Chicago Federal Reserve National Financial Conditions Index
By September 2023, US inflation was at 3.7%, which is up from 3.0% in June 2023. The inflation target in the US remains 2.5%. Unemployment in the US stood at 3.8% in September 2023. Full employment in a developed economy is between 4% and 5%, as there is usually a portion of the working age population that is unemployed. The US reached near full employment levels in 2021 already and the fear exists that if interest rates are lowered now, inflation may revive. It is speculated that interest rates may be increased once more to deal with inflation.
South Africa is in a position where its interest rate decisions are partly dependent on interest rate considerations elsewhere in the world. Domestic inflation seems to be under control despite increasing fuel prices, and economic growth is modest, but it is unlikely that the South African Reserve Bank (SARB) will cut interest rates before the US interest rate is lowered. Cutting South African interest rates out of sequence would lead to pressure on the rand exchange rate, which in turn will contribute to higher inflation on imported goods (e.g. oil). If inflation rises, the SARB will have to respond by increasing interest rates again.
South Africa’s economic growth projections have improved. The IMF now projects that the economy will expand by 0.9% in 2023 because of load shedding being contained to a lower-than-expected level in Q3 of 2023.
Crucially, South Africa’s fiscal position remains under pressure. Finance Minister Enoch Godongwana sounded the alarm that South Africa’s public finances are in a poor state. Lower revenue from tax collection and unbudgeted expenditure such as the unplanned salary increases granted to government workers in March 2023 reduce the chance of a primary budget surplus for 2023/24 and forces Government to borrow more at higher interest rates. This will result in a precariously high debt-to-GDP ratio and higher debt servicing cost in the years to come.
Financial markets
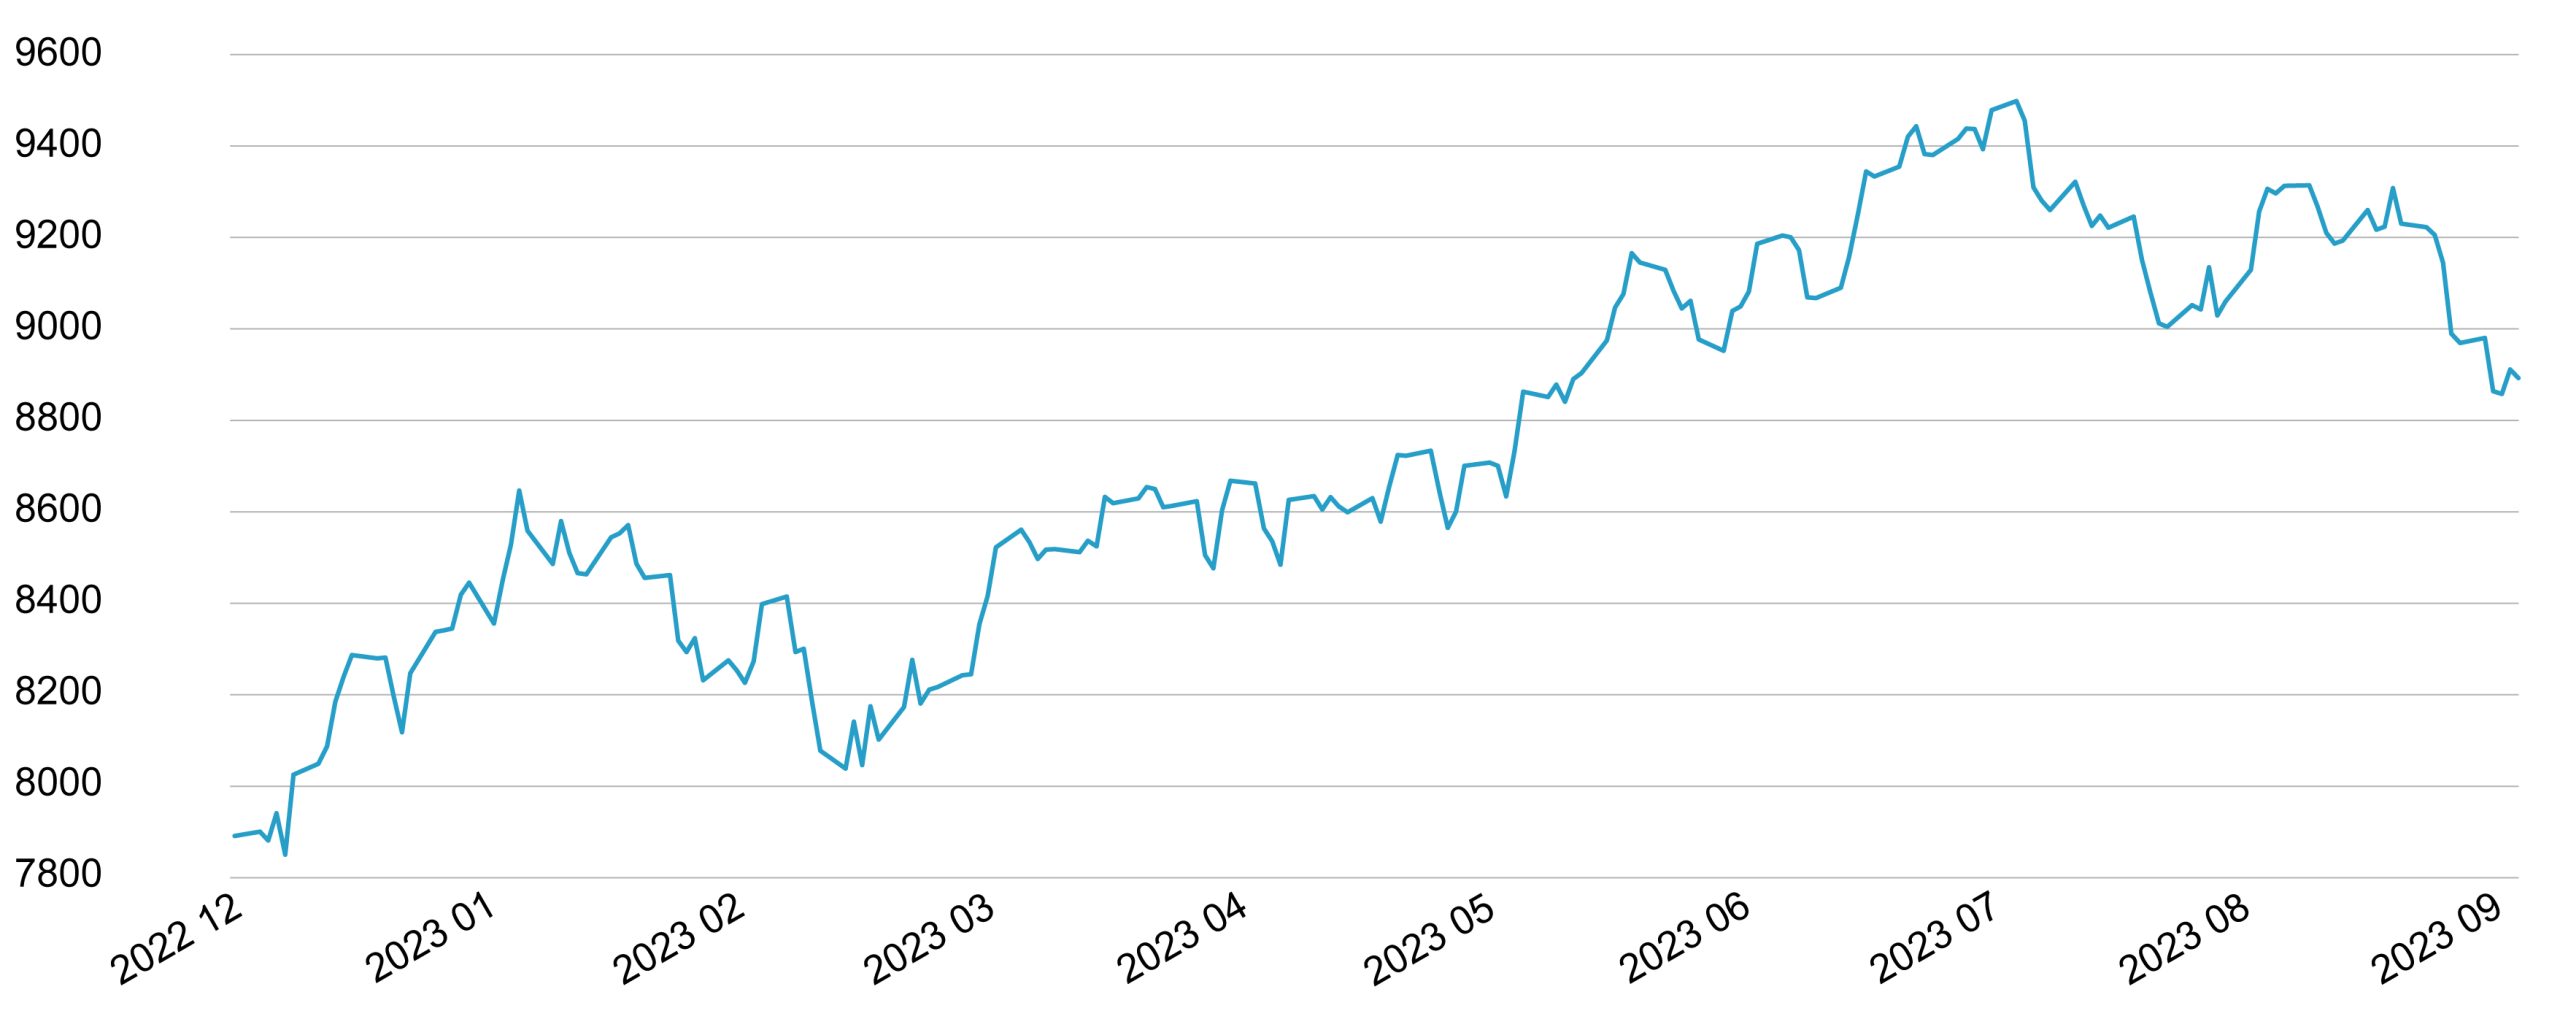
Domestic retirement funds’ investment returns for the calendar year to September 2023 were driven by exposure to offshore shares in developed markets. The MSCI G7 TR Index rose 20.2% in USD for the calendar year to July 2023, before closing September 2023 down 6% from July. In rand terms, the MSCI G7 was up 32.5% for the calendar year to 4 September 2023, but closed the month down 5.5%.
Chart: MSCI G7 Index TR in USD
The rand exchange rate remained stable for the quarter (-0.4%) but the rand weakened by 10% over the nine months to September 2023.
The FTSE/JSE All Share Index (ALSI) lost 3.5% for the quarter but is still up 2.2% for the calendar year to September 2023. Mining shares declined by 5.4% and industrial shares were 6.8% lower for the quarter. Even though financial shares came under pressure, they held on to 2% of their gains made earlier in the quarter.
The US 10-year government bond lost 4% of its value in USD terms in the quarter and nearly 10% in the nine months to September 2023. Similarly, the FTSE/JSE All Bond Index (ALBI) came under pressure losing 0.4% for the quarter. It is up only 1.4% for the nine months to September 2023.
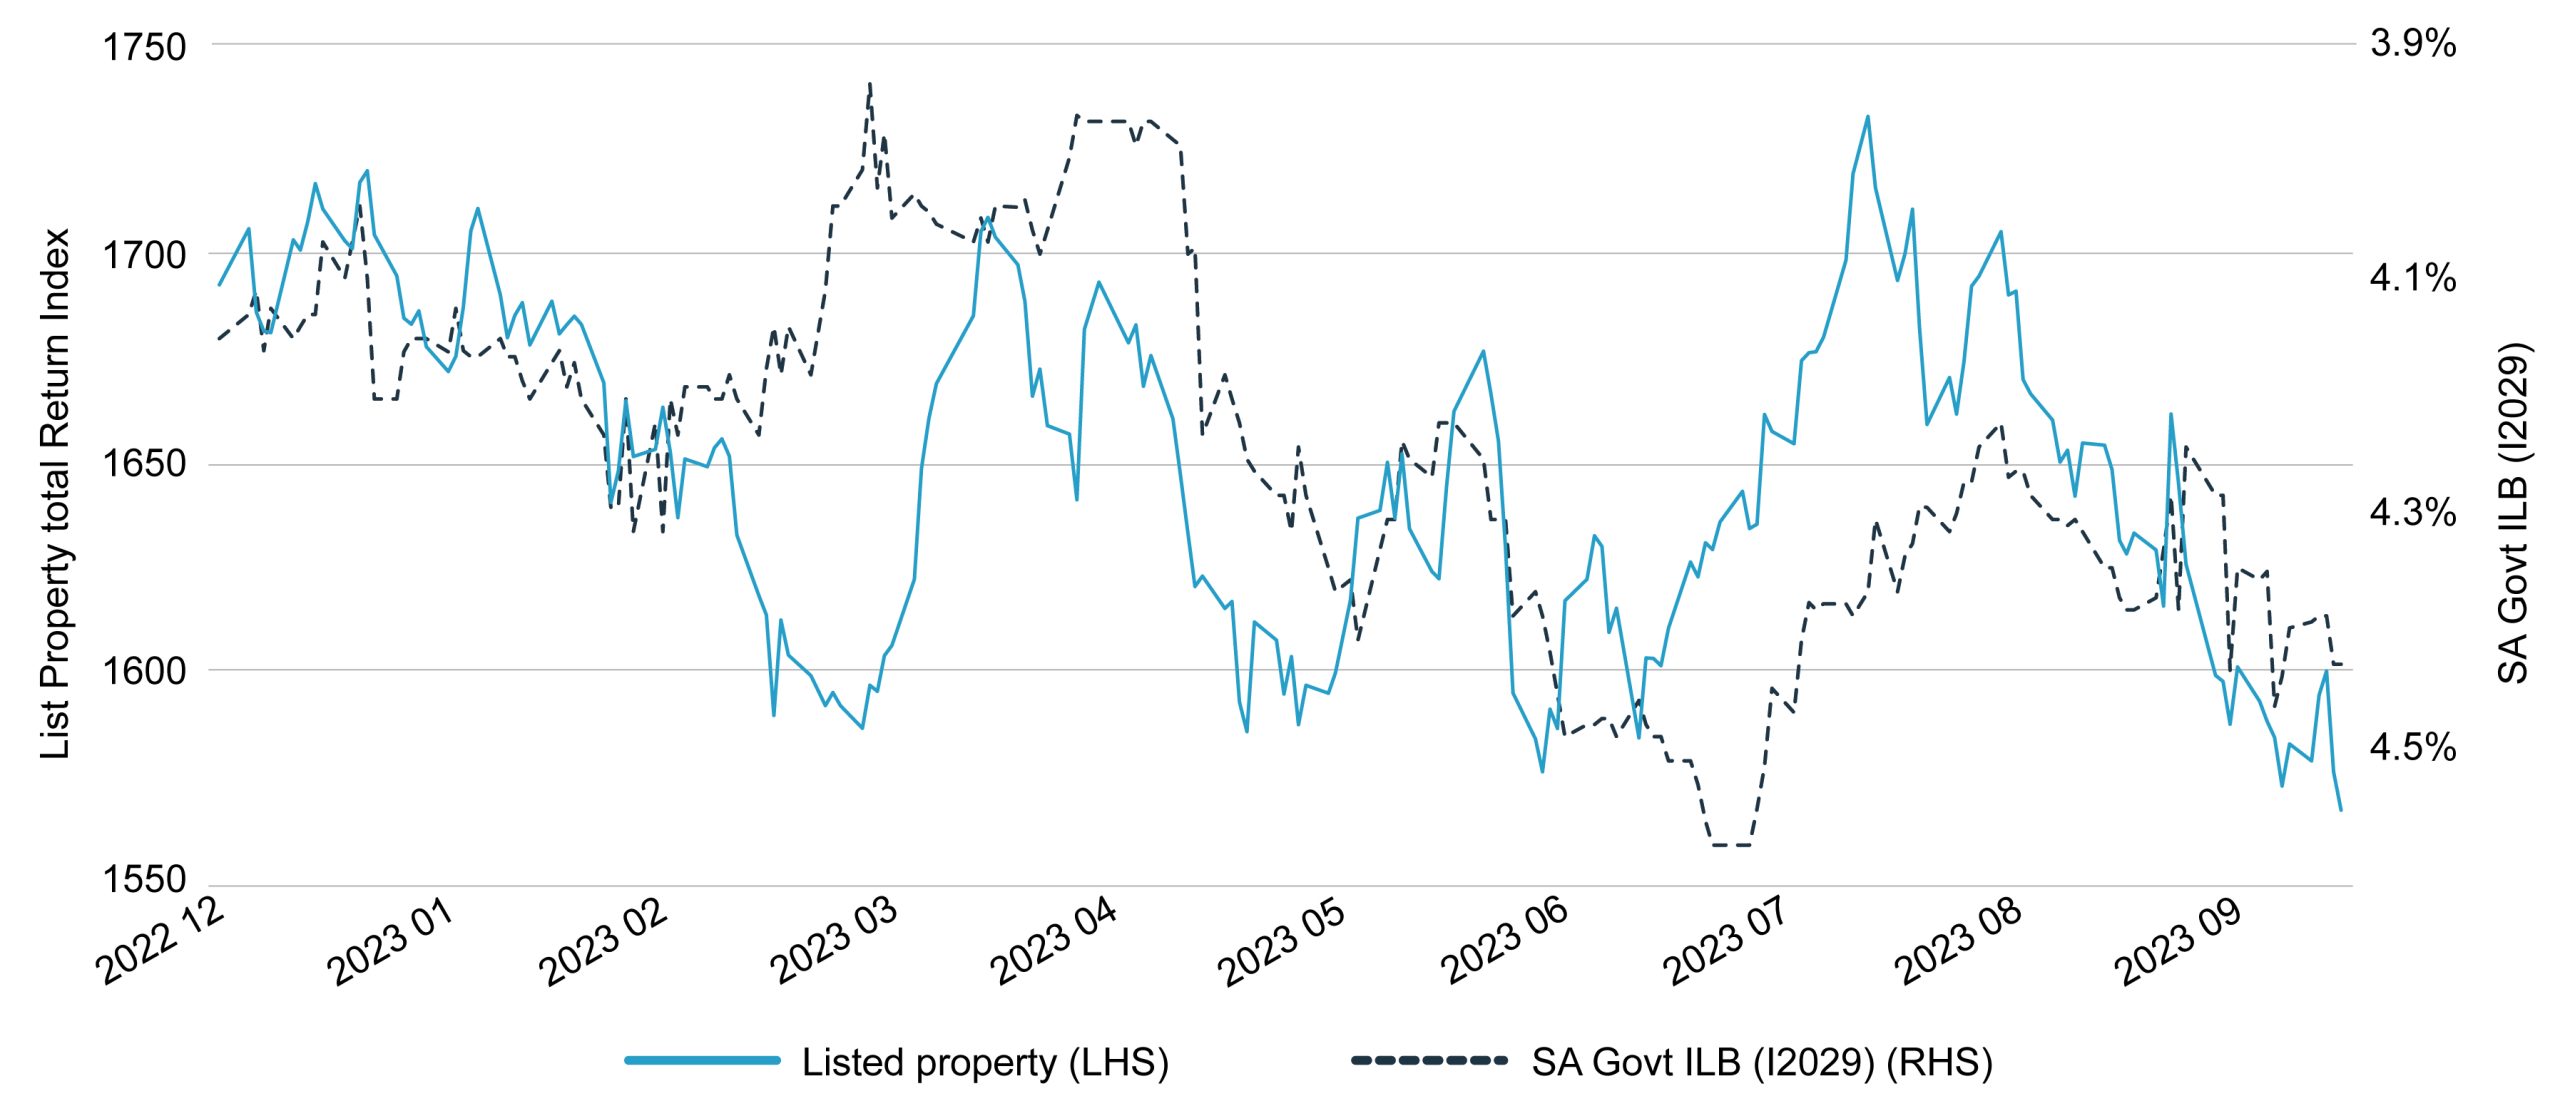
Listed property remains under pressure and continues to reflect the relatively high cost of capital employed by the sector, a proxy of which is the I2029 inflation-linked government bond yield.
Chart 3: Listed property / I2029 inflation-linked government bond yield
The investment returns generated by the indices representing the asset classes in which South African retirement funds typically invest are as follows:
| % Change September 2023 | Most recent quarter | Calendar YTD | 1 year
(p.a.) |
3 years (p.a.) | 5 years (p.a.) |
| All Share Index | -3.5% | 2.2% | 17.7% | 16.7% | 11.2% |
| Listed Property | -1.0% | -5.4% | 12.9% | 19.7% | -3.3% |
| STeFI Composite | 2.0% | 5.8% | 7.5% | 5.6% | 6.6% |
| BEASSA ALBI | -0.4% | 1.4% | 7.2% | 7.4% | 8.2% |
| MSCI All Country World ZAR | -2.9% | 22.8% | 27.0% | 11.8% | 13.4% |
| Barclays Global Aggregate ZAR | -3.2% | 8.7% | 6.9% | -3.1% | 4.3% |
| Rand (+ strengthening, – weakening) | -0.4% | -10.0% | -4.4% | -3.8% | -5.1% |
| Inflation (estimate) | 1.7% | 4.2% | 5.3% | 6.3% | 5.5% |
| Gold ZAR | -2.6% | 12.7% | 16.4% | 3.4% | 15.7% |
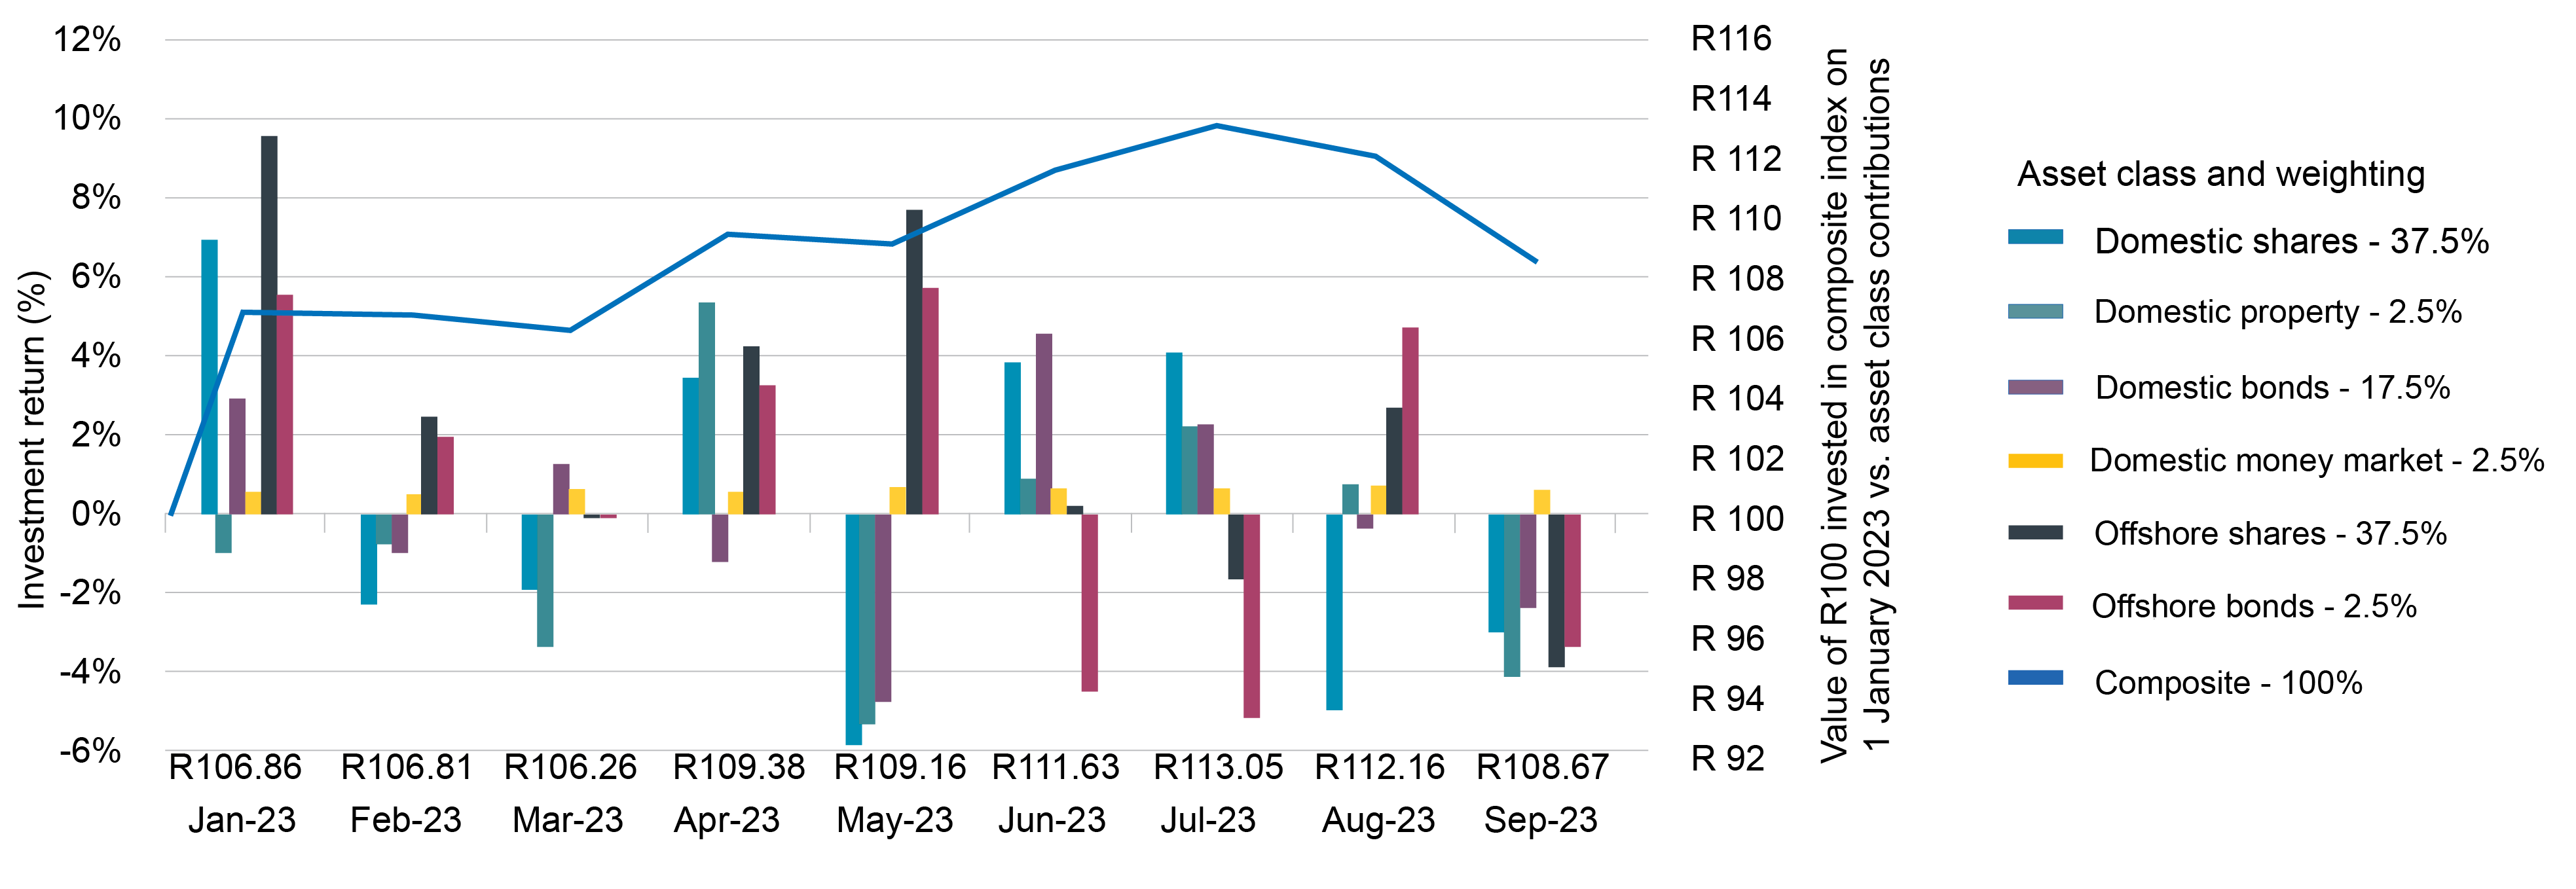
The investment return on a Regulation 28 compliant aggressive index composite with maximum offshore exposure and exposure to shares came to 8% for the nine months to 2023. Early indications are that global balanced funds achieved returns of about 7% for the quarter.
Chart 4: Value of R100 invested in composite index on 1 January 2023 vs asset class contributions
After several years of elevated volatility, long-term investment returns have not recovered sufficiently for members to be comfortable.
Information for this article has been obtained from several sources: www.chicagofed.org/research/data/nfci/current-data, National Treasury, Stats SA and IRESS.