Increasing the offshore investment limit to 45% – 13 April 2022
The impact on retirement funds
The offshore investment limit for all insurance, retirement and savings funds has recently been increased to 45%, inclusive of the 10% allowance for investment in Africa (excluding South Africa). This forms part of modernising South Africa’s capital flow management framework to boost long-term investment.
South African retirement funds can now invest an extra 15% of their assets outside of South Africa. The substantial relaxation of exchange controls comes at a time when South African investments are considered to be more attractive than offshore investments and most asset managers have an underweight position relative to the previous offshore limit of 30%.
How does this affect retirement funds?
The difficult question is: How much should retirement funds invest in offshore assets given the increased limit?
In this note, we provide some guidance by considering the following two broad types of retirement funds:
- Retirement funds with a low governance budget, delegating or outsourcing domestic/offshore asset allocation decisions to investment managers, multi-managers and/or implemented solution service providers.
- Others, with higher governance budgets, that take charge of asset allocation decisions.
Type I retirement funds: Retirement funds that outsource their domestic/offshore asset allocation decisions to investment managers, multi-managers and/or implemented solution service providers
Retirement funds that outsource their domestic/offshore asset allocation decisions invest in multi-asset investment portfolios including local and offshore investments. These retirement funds will rely on investment professionals to change the asset allocation in their portfolios in response to the increased offshore allowance. Investment portfolios with a high exposure to equities (shares), i.e. “wealth creation” portfolios, will be most affected. More conservative investment portfolios with lower exposure to equities typically have offshore allocations lower than 30%.
Investment managers have generally welcomed the decision to increase the offshore investment limit. However, so far (as at the date of publishing this article) most asset managers have indicated that they are unlikely to increase their allocation to offshore assets in the short term. This is a tactical short-term view, which does not mean these managers will remain overweight to local investments indefinitely.
Investment managers have advised that their allocation to offshore investments is driven by opportunities offered by compelling valuations. Currently, domestic investments are considered cheap, especially when compared with developed market bonds and equities. As a result, asset managers’ exposure to offshore investments has generally been under the previous 30% limit, as can be seen in the graph 1.
Graph 1: Average asset allocation of large asset managers as at 28 February 2022

In our view, the benign long-term economic growth outlook for South Africa and a much wider opportunity set in the global market will drive a gradual shift closer to 45% offshore in “wealth creation” portfolios, but we expect a much wider dispersion in asset allocation decisions.
When investment managers’ view on the attractiveness of offshore relative to local investments improves, the road to increasing offshore investment exposure will be interesting. We expect an increase in the dispersion of returns achieved by different asset manager portfolios with similar risk profiles. Graph 2 below shows the performance of “wealth creation” portfolios where investment managers and multi-managers allocate to offshore assets. The performance is over a 5-year period ended 28 February 2022.
Graph 2: Investment performance over 5 years ended 28 February 2022
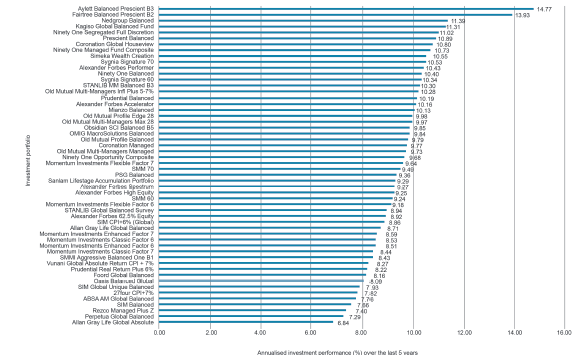
Among other things, the increase in dispersions will be due to:
- differences in the portfolios’ offshore exposure
- the extent to which managers of various portfolios are active around the domestic/offshore allocation
- differences in the composition of offshore portions of the portfolios by various investment managers.
Investment manager selection and choice of suitable investment mandates will become more important for retirement funds that rely on investment professionals to decide on the allocation to offshore assets
In many cases, multi-managers make decisions on allocations between domestic and offshore assets. The dispersion of returns between multi-managers is expected to be larger as a result of different views they take. The choice of a multi-manager will also be important, and trustees will need to interrogate the offshore asset allocation and manager selection processes of the multi-managers.
Many retirement funds have appointed asset managers with a fully discretionary mandate to manage local and global assets. Simeka has for some time argued that it is more efficient to manage global assets in a more diversified way by separating the management of global and local assets. In our view, the increase in the international limit to 45% should be a catalyst for retirement funds to review their strategy to allow local managers to manage local and global assets.
There is a valid argument that the new 45% international limit will substantially increase the “degrees of freedom” for local managers that manage local and global assets. Instead of viewing the global portion of the portfolio as a “bolt onto” the local component, asset managers now have an opportunity to manage local and global assets in a fully integrated manager. This means that, for example, in managing the equity portion of the portfolio managers now have much more freedom to select equities from a global universe including South Africa, rather than selecting local and global equities separately. The same could apply to other asset classes. Whilst in theory this sounds attractive, we are not convinced that portfolios will in practice be managed in a fully integrated manner.
Managing global assets has been argued to be more expensive than managing domestic assets. It will be interesting to see if asset managers and multi-managers will increase their fees as their allocation to global assets increases – either through direct asset management fees paid by retirement funds, or through total investment charges (TICs).
In our view, it is more appropriate for retirement funds to assess whether they will achieve sufficient diversification in offshore assets by using a few local managers to manage both local and offshore assets. Many retirement funds will likely conclude that it is now more appropriate for global assets to be managed separately from local assets in a much more diversified way. Retirement funds may need to increase their investment governance budget on global assets and seek ways to achieve satisfactory diversification.
Implications for type II retirement funds: Retirement funds that take charge of their own domestic/offshore asset allocation decisions
These retirement funds have a much higher governance budget to focus on their investment programmes and to make their own long-term strategic asset allocation decisions, including how much to allocate to offshore investments. They select asset managers they consider to be best in class within each of the asset classes, separately for local and global assets.
A difficult situation arises for the trustees of type II retirement funds because of the increased offshore investment limit. For investment portfolios with lower risk profiles, e.g. low or medium equity portfolios, the strategic allocation to offshore has typically been well under the previous 30% limit. The increased offshore allowance should have a limited impact on these portfolios. However, investment portfolios with higher risk profiles, i.e. “wealth creation” portfolios, will need to be evaluated because their strategic allocation to offshore has likely been set very close to the previous 30% maximum within a paradigm of the 30% offshore allowance being below an optimal allocation.
A key driving force in favour of investing offshore over the long term is that there are many more investment opportunities available outside of South Africa. If retirement funds used South Africa’s share of global GDP or market capitalisation (total size of investments) relative to the rest of the world, we would end up with more than 99% being invested offshore! However, retirement funds also need to ensure that the fund’s asset strategy is appropriate to cover liabilities. Most retirement fund members ultimately retire in South Africa and therefore retirement benefits (fund liabilities) are rand denominated. Investment strategies should cater for this, even for “wealth creation” portfolios. Currency movements add volatility to portfolios. Therefore, volatility due to currency movements will be higher for portfolios with a higher allocation to offshore assets, so the optimal offshore allocation will need to consider this.
Retirement funds in emerging markets (including South Africa) need to pay more attention to currency volatility because of the instability of their domestic currencies. Interestingly, even retirement funds in countries with more stable currencies, such as developed European countries, have a significant “home bias” in their asset allocations, as shown by the graph 3. Countries such as the UK and other major economies in Europe have most of their assets invested in their domestic economies.
Graph 3: Share of pension fund assets invested offshore

A home bias often exists because retirement fund trustees are more familiar and comfortable dealing with their local market, especially if that market has adequate breadth of opportunities and liquidity. Many of the retirement funds with the highest proportion of assets invested offshore are those based in countries with small capital markets.
The factors discussed above highlight the complexity faced by the trustees when evaluating the impact of an increased offshore investment limit on their portfolios. The impact can be assessed using strategic asset allocation modelling – a process to determine long-term asset allocation based on quantitative techniques and a professional judgement overlay informed by experience. The asset allocation modelling tools are useful as they bring science into the decision-making process. The results of the process rely on the inputs including expected long-term returns and risk on each asset class considered. Even though the calculation of expected long-term returns and risk is an objective process, the choice of data used in the calculations is subjective.
Graph 4 illustrates the impact of using various assumptions on the results of the process. The strategic asset allocation results have been formulated using two categories of data, as follows:
- Based on actual historical 1-, 5-, 10- and 20-year asset class real returns (after subtracting inflation from the returns)
- Using forward-looking expected real return assumptions based on scenarios developed by Simeka. The forward-looking expected real returns have been formulated using a high road scenario (favourable domestic investment environment), low road scenario (unfavourable domestic investment environment) and mid-road scenario, which is a middle road between the other two scenarios.
Graph 4: Strategic asset allocation under various investment return scenarios

| Asset class | Historical real returns over periods ended Feb 2022 | Forward-looking real return assumptions | |||||
| 1 year | 5 years | 10 years | 20 years | High road | Mid-road | Low road | |
| SA equities | 15.2% | 7.8% | 6.8% | 8.6% | 6.0% | 5.0% | 4.0% |
| SA bonds | 3.7% | 4.7% | 3.1% | 4.7% | 4.5% | 4.0% | 3.0% |
| SA cash | -1.4% | 2.0% | 1.2% | 2.5% | 0.5% | 0.0% | -0.5% |
| Global equities | 7.2% | 11.5% | 14.0% | 4.5% | 5.5% | 6.0% | 7.0% |
| Global bonds | -8.9% | 1.6% | 3.6% | 1.9% | 1.0% | 0.0% | 1.5% |
| Global cash | -3.4% | 0.4% | 3.4% | -1.9% | 0.0% | 0.5% | 2.0% |
The following market indices have been used: SA equities (FTSE/JSE All Share), SA bonds (ALBI), SA cash (STeFI), Global equities (MSCI World), Global bonds (JPM Global GBI), Global cash (90-day US Treasury Bill Rate).
Strategic allocation to SA cash is often driven by qualitative reasons, as quantitative methods would usually make little to no allocation to this asset class. The lack of allocation to global bonds and global cash is due to these asset classes’ unfavourable long-term return prospects as a result of the low interest rate environment and poor past performance. The allocation is primarily made to growth asset classes such as SA equity and global equity with SA bonds being a diversifier.
Global equities have outperformed domestic asset classes over the past 5 and 10 years. Using this data in the modelling process results in a full 45% weighting to global equities. However, there are periods when domestic asset classes outperform global asset classes, such as the decade from 2000. This is reflected in the performance over the last 20 years. Making decisions on the basis of historic data when South African investments outperformed results in a much lower allocation to offshore. Graph 5 shows the performance of domestic and global equities over rolling 5-year periods, illustrating that domestic and global markets outperform each other in cycles.
Graph 5: Investment returns (annualised) of SA equities and global equities over 5-year rolling periods

While looking at the past is important, decisions should be made on a forward-looking view. Attaching equal probabilities to each of the scenarios outlined above in the forward-looking analysis results in a long-term allocation of 40% to offshore assets.
The final decision made by the trustees will include considerations of other asset classes such as listed property, listed infrastructure, emerging market assets and private markets.
The strategic asset allocation represents a passive alternative strategy against which trustees can measure the value added by tactical decisions. The implementation of the strategic asset allocation will take into account trustees’ beliefs (based on empirical evidence) on value that can be added by active strategies and alternative asset classes.
Conclusion
The announcement to increase the offshore limit has been welcomed, as it provides more tools in the investment kit for retirement funds to meet their long-term investment objectives. However, caution must be applied as retirement funds can now invest up to 45% in offshore assets – a limit that is higher than the optimal allocation to offshore assets. The decision on how to invest in offshore assets is also more complex and should include an assessment of a wider opportunity set than many retirement funds have considered to date.
Information for this article obtained from several sources:
Graph 1: Alexander Forbes’ Spectrum portfolio, which is a fully discretionary balanced portfolio split among the managers participating in the Alexander Forbes Global Large Manager WatchTM survey. Graph 2: Simeka Retirement Fund Monitor, Simeka Wealth Creation Global peer group. Graph 3: OECD (2021), Pension Markets in Focus 2021, www.oecd.org/finance/pensionmarketsinfocus.htm. Graph 4: Simeka Consultants and Actuaries. Graph 5: IRESS, Simeka Consultants and Actuaries.